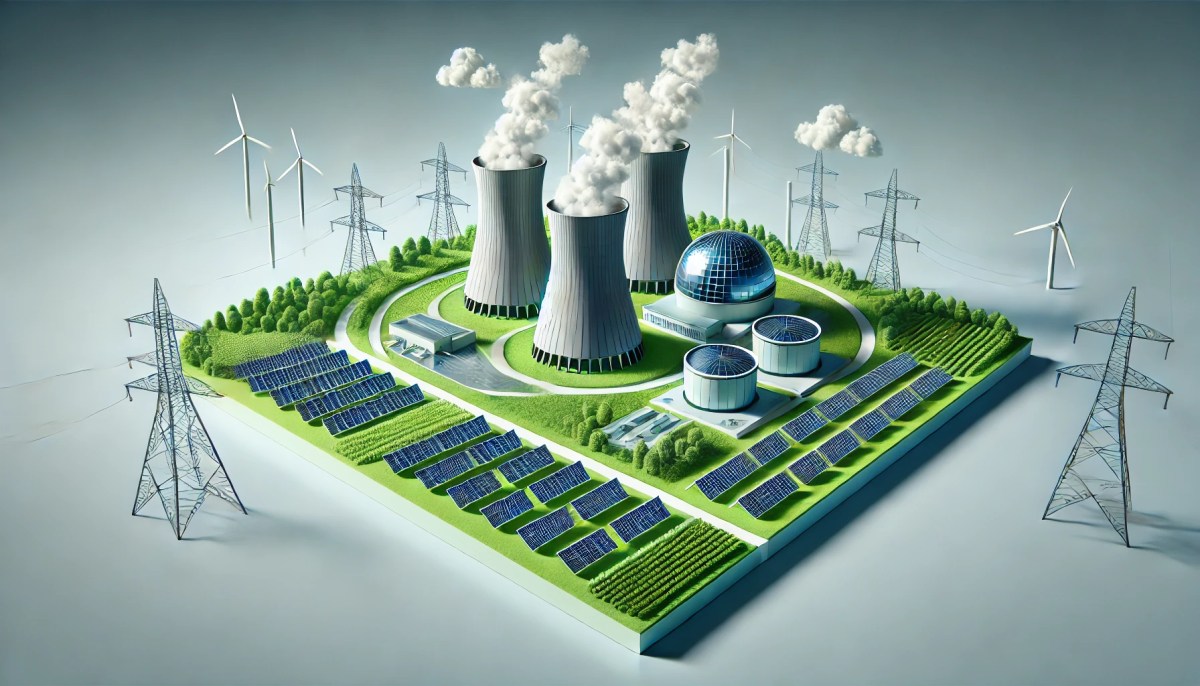
Nuclear vs. Renewables:
The Future of American Energy
A comprehensive analysis of America's clean energy trade-offs in 2025
Key Finding
The optimal path forward likely involves leveraging the strengths of both: using nuclear power as a stable foundation while scaling up renewables to drive down costs and emissions.
Executive Summary
The United States faces a critical energy decision: how to balance the reliable, low-carbon foundation of nuclear power with the rapidly declining costs and scalability of renewable energy sources.
Our analysis reveals a complex trade-off: nuclear power offers unparalleled reliability and a tiny land footprint, providing consistent, low-carbon baseload power. However, it is plagued by extremely high upfront costs, long construction times, and the persistent challenge of managing radioactive waste.
Renewable sources like solar and wind have seen their costs plummet, making them the cheapest form of new electricity, and they avoid the issue of radioactive waste. Yet, they are intermittent, requiring vast amounts of land and significant investment in grid management and energy storage to ensure reliability.
Environmental Impact: A Tale of Emissions, Waste, and Land
Carbon Footprint: The Lifecycle Story
A lifecycle assessment reveals the complete carbon story, moving beyond simple operational emissions to account for manufacturing, construction, and decommissioning. According to IPCC data, all clean energy sources are vastly superior to fossil fuels.
Key Insight: Wind energy edges out nuclear with just 11 g CO₂e/kWh vs nuclear's 12 g CO₂e/kWh, while solar PV has a higher footprint at 41 g CO₂e/kWh.
Nuclear's Low-Carbon Credentials
Nuclear energy's exceptionally low lifecycle emissions of 12 g CO₂e/kWh stem from uranium's incredible energy density. A small amount of fuel produces massive power, minimizing continuous extraction and transportation needs.
Wind Power's Slight Edge
Wind energy achieves the lowest carbon footprint at 11 g CO₂e/kWh, benefiting from zero fuel combustion and relatively low material intensity.
Waste Generation: The Hidden Environmental Cost
Key Trade-off: Nuclear creates 99.8% less waste by volume than solar, but that waste remains hazardous for millennia.
Land Use and Resource Intensity
Nuclear's High Energy Density
A standard 1,000 MW nuclear plant requires only about one square mile of land, powering a large city from a compact footprint. This minimizes ecosystem impact and enables location near population centers.
Advantage: Nuclear's unmatched energy density means minimal land disruption per unit of power generated.
Land Requirements for Renewables
To match 1,000 MW of nuclear capacity:
- Wind farm: 360 square miles
- Solar farm: 75 square miles
Reliability and Grid Stability: Baseload vs. Intermittency
Nuclear Power: The Constant Provider
High Capacity Factors (85-95%)
Nuclear plants achieve exceptionally high capacity factors of 85% to 95%, meaning they operate at full power nearly year-round, only pausing for scheduled maintenance.
Why This Matters
- • Predictable, reliable power supply
- • Grid stability foundation
- • Consistent return on investment
Role in Providing Baseload Power
Nuclear reactors excel at providing baseload power— the constant, minimum electricity demand. Unlike intermittent renewables, nuclear can run continuously at steady rates, ensuring fundamental energy needs are always met.
The Intermittency Challenge of Renewables
Weather Dependency
Wind and solar output fluctuates with weather conditions, creating uncertainty that requires careful grid management and backup power sources.
Grid Management Solutions
Integrating high percentages of renewables requires:
- • Advanced weather forecasting
- • Flexible backup power sources
- • Energy storage systems
- • Demand response programs
The Economics of Energy: Cost, Investment, and Jobs
Cost Comparison: LCOE Analysis
Declining Renewable Costs
Solar and wind costs have plummeted dramatically. According to the U.S. Energy Information Administration:
High Nuclear Capital Costs
Nuclear power remains capital-intensive, with construction costs ranging from $8,765 to $14,400 per kW of capacity in 2024.
Projected to remain stable through 2050, while renewable costs continue falling.
Government Subsidies and Investment Flows
Policy Impact on Investment
Government policy significantly shapes energy markets. The Inflation Reduction Act of 2022 extended tax credits for both renewables and nuclear, though public support differs.
2025 Impact: Despite record global renewable investment, U.S. renewable investment declined 36% in H1 2025 amid policy uncertainty.
Public R&D Funding
Funding has shifted from traditional nuclear to renewables, but interest in advanced nuclear technologies like Small Modular Reactors (SMRs) is growing.
Job Market Impact
Public Perception and Political Landscape in 2025
Shifting Public Opinion
Growing Support for Nuclear
Climate urgency is driving reevaluation of nuclear risks vs. benefits. Younger generations increasingly view nuclear as a necessary climate tool.
Key Drivers of Support
- • Climate crisis urgency
- • Recognition of reliability benefits
- • Baseload power necessity
- • Advanced safety technologies
The "Banana Equivalent Dose" Analogy
Nuclear advocates use the "banana equivalent dose" (BED) to contextualize radiation fears, comparing plant radiation to eating a single banana.
Radiation Comparison
Living next to a nuclear plant for one year = eating one banana's radiation
A six-hour flight = more radiation than annual plant neighbor exposure
Partisan Divides and Policy Implications
Republican Support for Nuclear
Republicans increasingly embrace nuclear as part of "all-of-the-above" strategy, framed in terms of national security and energy independence.
Trump Administration Actions
- • Defined "energy" to exclude wind/solar
- • Paused offshore wind leasing
- • Reviewed federal wind projects
- • Supported uranium and nuclear
Democratic "All-of-the-Above" Strategy
Democrats advocate for comprehensive clean energy including both renewables and nuclear, with Biden's goal of 100% clean electricity by 2035.
Biden Administration Pillars
- • Zero-carbon electricity
- • Decarbonized infrastructure
- • Advanced clean energy tech
- • Methane emissions reduction
The US Energy Mix: Current State and Future Projections
Nuclear's Enduring Contribution
Nuclear power continues providing approximately 20% of total US electricity and nearly half of all carbon-free electricity, making its continued operation essential for climate goals.
Critical Role
Loss of nuclear capacity would make decarbonization significantly more difficult and expensive, requiring massive rapid expansion of other clean energy sources.
Renewables' Rapid Rise
Solar and wind are transforming the energy landscape. In the first half of 2025, wind generation grew 5% while solar output surged 30% year-over-year.
Historic Milestone
In 2020, renewables generated more electricity than coal for the first time in US history, a trend that has continued and strengthened.
Long-Term Outlook to 2050
The future US energy mix will likely feature:
- Significant renewable expansion: Continued cost declines driving growth
- Nuclear's continued role: Providing stable baseload foundation
- Natural gas as bridge fuel: Supporting grid flexibility during transition
- Emerging technologies: SMRs, energy storage, carbon capture
The Path Forward
The evidence points to a clear conclusion: America's energy future requires both nuclear and renewables, not an either/or choice.
Nuclear's Essential Role
- • Reliable baseload foundation
- • Tiny land footprint
- • Proven carbon-free technology
- • Economic challenges require policy support
Renewables' Dominant Growth
- • Unbeatable cost trajectory
- • Rapid deployment capability
- • Job creation engine
- • Grid integration challenges to solve
Key Recommendation: Pursue a hybrid strategy leveraging nuclear's reliability with renewables' scalability, while investing in grid modernization and energy storage to create a resilient, low-carbon energy system.