Kimi Sheets Use Cases
Financial Valuation
📊 Like a financial analyst, Kimi helps you gather real financial data, build a DCF valuation model, and run a simulated company valuation.
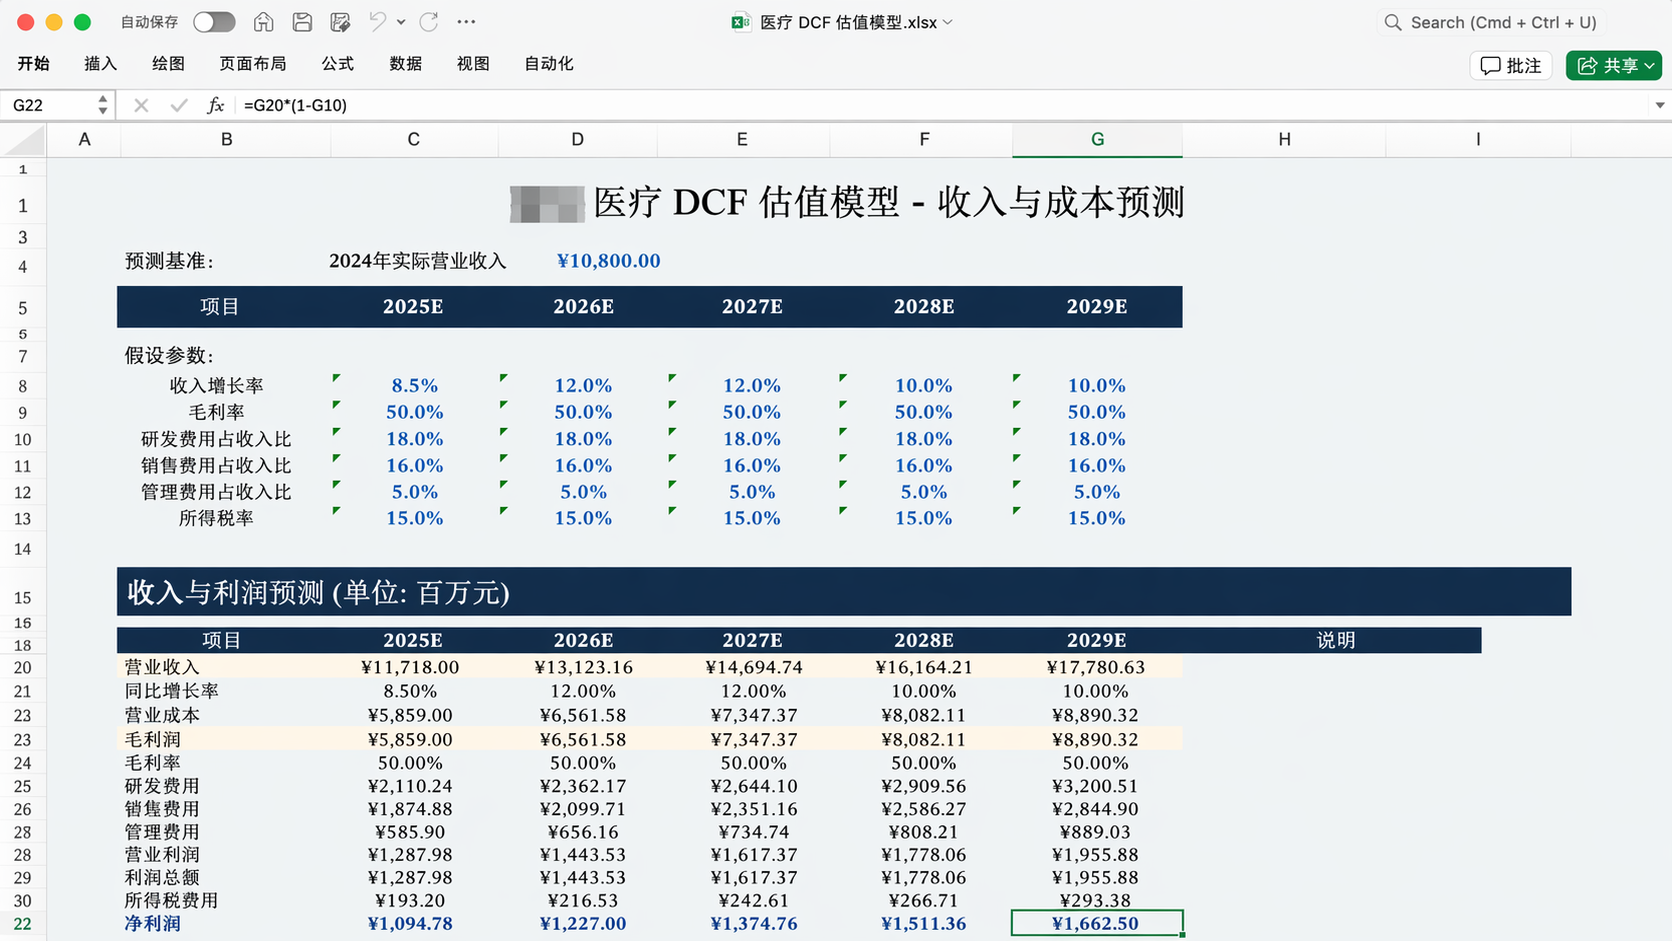
Prompt reference:
Text
Storyboard Creation
🎥 Like a storyboard artist, Kimi helps you create an Excel-format video storyboard script, including duration, scene descriptions, voiceover, sound effects, and reference images for each shot.
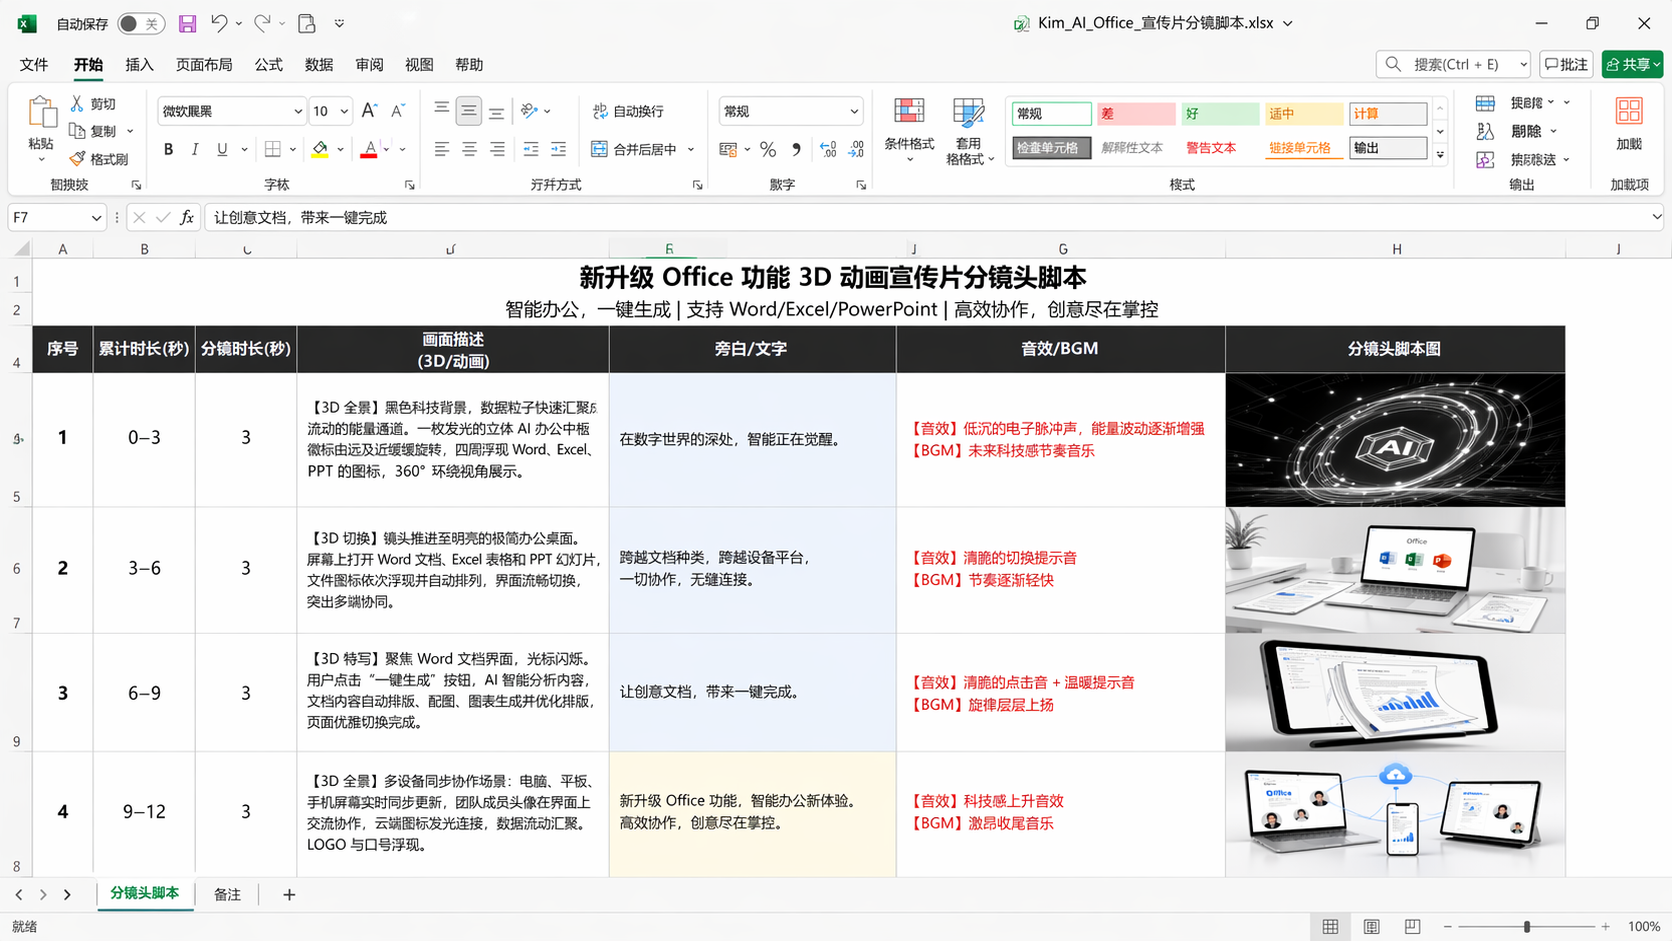
Prompt reference:
Text
More Scenarios and Prompt References
| Scenario | Example prompt |
|---|---|
| Financial modeling | Use the DCF method to value XX Company. Put the full process and data into Excel, cite data sources, and explain the estimation logic for key assumptions such as growth rate. |
| Industry data comparison | Research the top 20 domestic new energy vehicle companies, list market capitalization, 2025 sales volume, flagship models, and recent news, and output a comparison table. |
| Organize literature into a table | Search for papers from the past three months on LLM inference optimization and organize them in Excel, including title, authors, core method, and innovations. |
| Merging multiple spreadsheets | [Upload 12 months of sales Excel files] Merge these 12 spreadsheets into an annual summary, calculate month-over-month growth for each month, and use formulas to link multiple sheets. |
| Sales lead extraction | [Upload trade show PDF/images] Extract all exhibitor information and organize it into a 1,000-row sales leads Excel file, including company name, contact details, and product category. |
| Project management sheet | Create a PMO project management Excel file for me, including task list, owner, progress status, Gantt chart, and linked sheets. |
| Data visualization | Turn this sales data Excel into a visual dashboard, including a trend line chart, regional distribution chart, and completion-rate donut chart. |
Was this article helpful?