Built-in Browser
The built-in browser lives in the right panel, where tabs stay with the session. You can open web pages inside the app, ask the Agent to read and interact with pages, take control yourself at any time, and send problematic elements back to the Agent with annotations. If a task needs your real browser with its existing sign-in state, use the Kimi WebBridge plugin—see Settings and Extensions.
Open pages
- In the right panel, click + (New tab) and choose Browser. You can also choose File → New Browser Tab in the app menu.
- Enter a URL in the address bar at the top of the tab to open the page.
- To check a local project, start its local service first (or ask the Agent to start it), confirm the actual URL and port from the startup output, then visit that address.
- You can also send the address to the Agent and ask it to open the page in the built-in browser. For example:
Open the local page we just started in the built-in browser, confirm it loads, and tell me the actual URL.Operate pages and take over control
Let the Agent operate
Describe the page to verify, the steps, and the expected results, and the Agent will check them in order. It can read page text, list page elements, and take screenshots, and it can click, type, fill in forms, choose options, and scroll. For example:
Open the local app in the built-in browser. Check that navigation links lead to the expected pages and that submitting the form with required fields left empty shows validation messages. Report each result. For any failure, include the steps to reproduce it and what happened.- Ask the Agent to report each check result; for failures, ask for the reproduction steps and the actual behavior.
- Beyond whether the page loads, verify the interactions affected by your changes, such as button clicks, input validation, and navigation.
Watch the operation
While the Agent works, the tab shows "Agent is controlling this tab". You can watch its actions at any time, or ask it to show you a specific page.
Take over and hand back control
When you need to check something manually, click Take over on the browser to stop the Agent's actions and take control of the page—you can then click, type, or inspect the page yourself, and the control area shows how long you have been in control.
Once you take over, the Agent stops operating the browser for the current turn. When you are done, simply continue the conversation and the Agent resumes operating on the next turn. When you continue, explain what you tried manually, any problems you found, and what to check next, and the Agent will pick up from there.
Annotate and send feedback
- Right-click the page and choose Annotate element, then select the page element you want to report. You can also drag to select a region (region annotations require a screenshot).
- In the Annotate page panel, add a comment describing the actual behavior and the expected result. The annotation captures element details; enable the screenshot option to attach a page screenshot.
- Click Add to Composer and the annotation is added to the session Composer as a reference. Review the annotation and description in the Composer, then send them so the Agent can locate the problem.
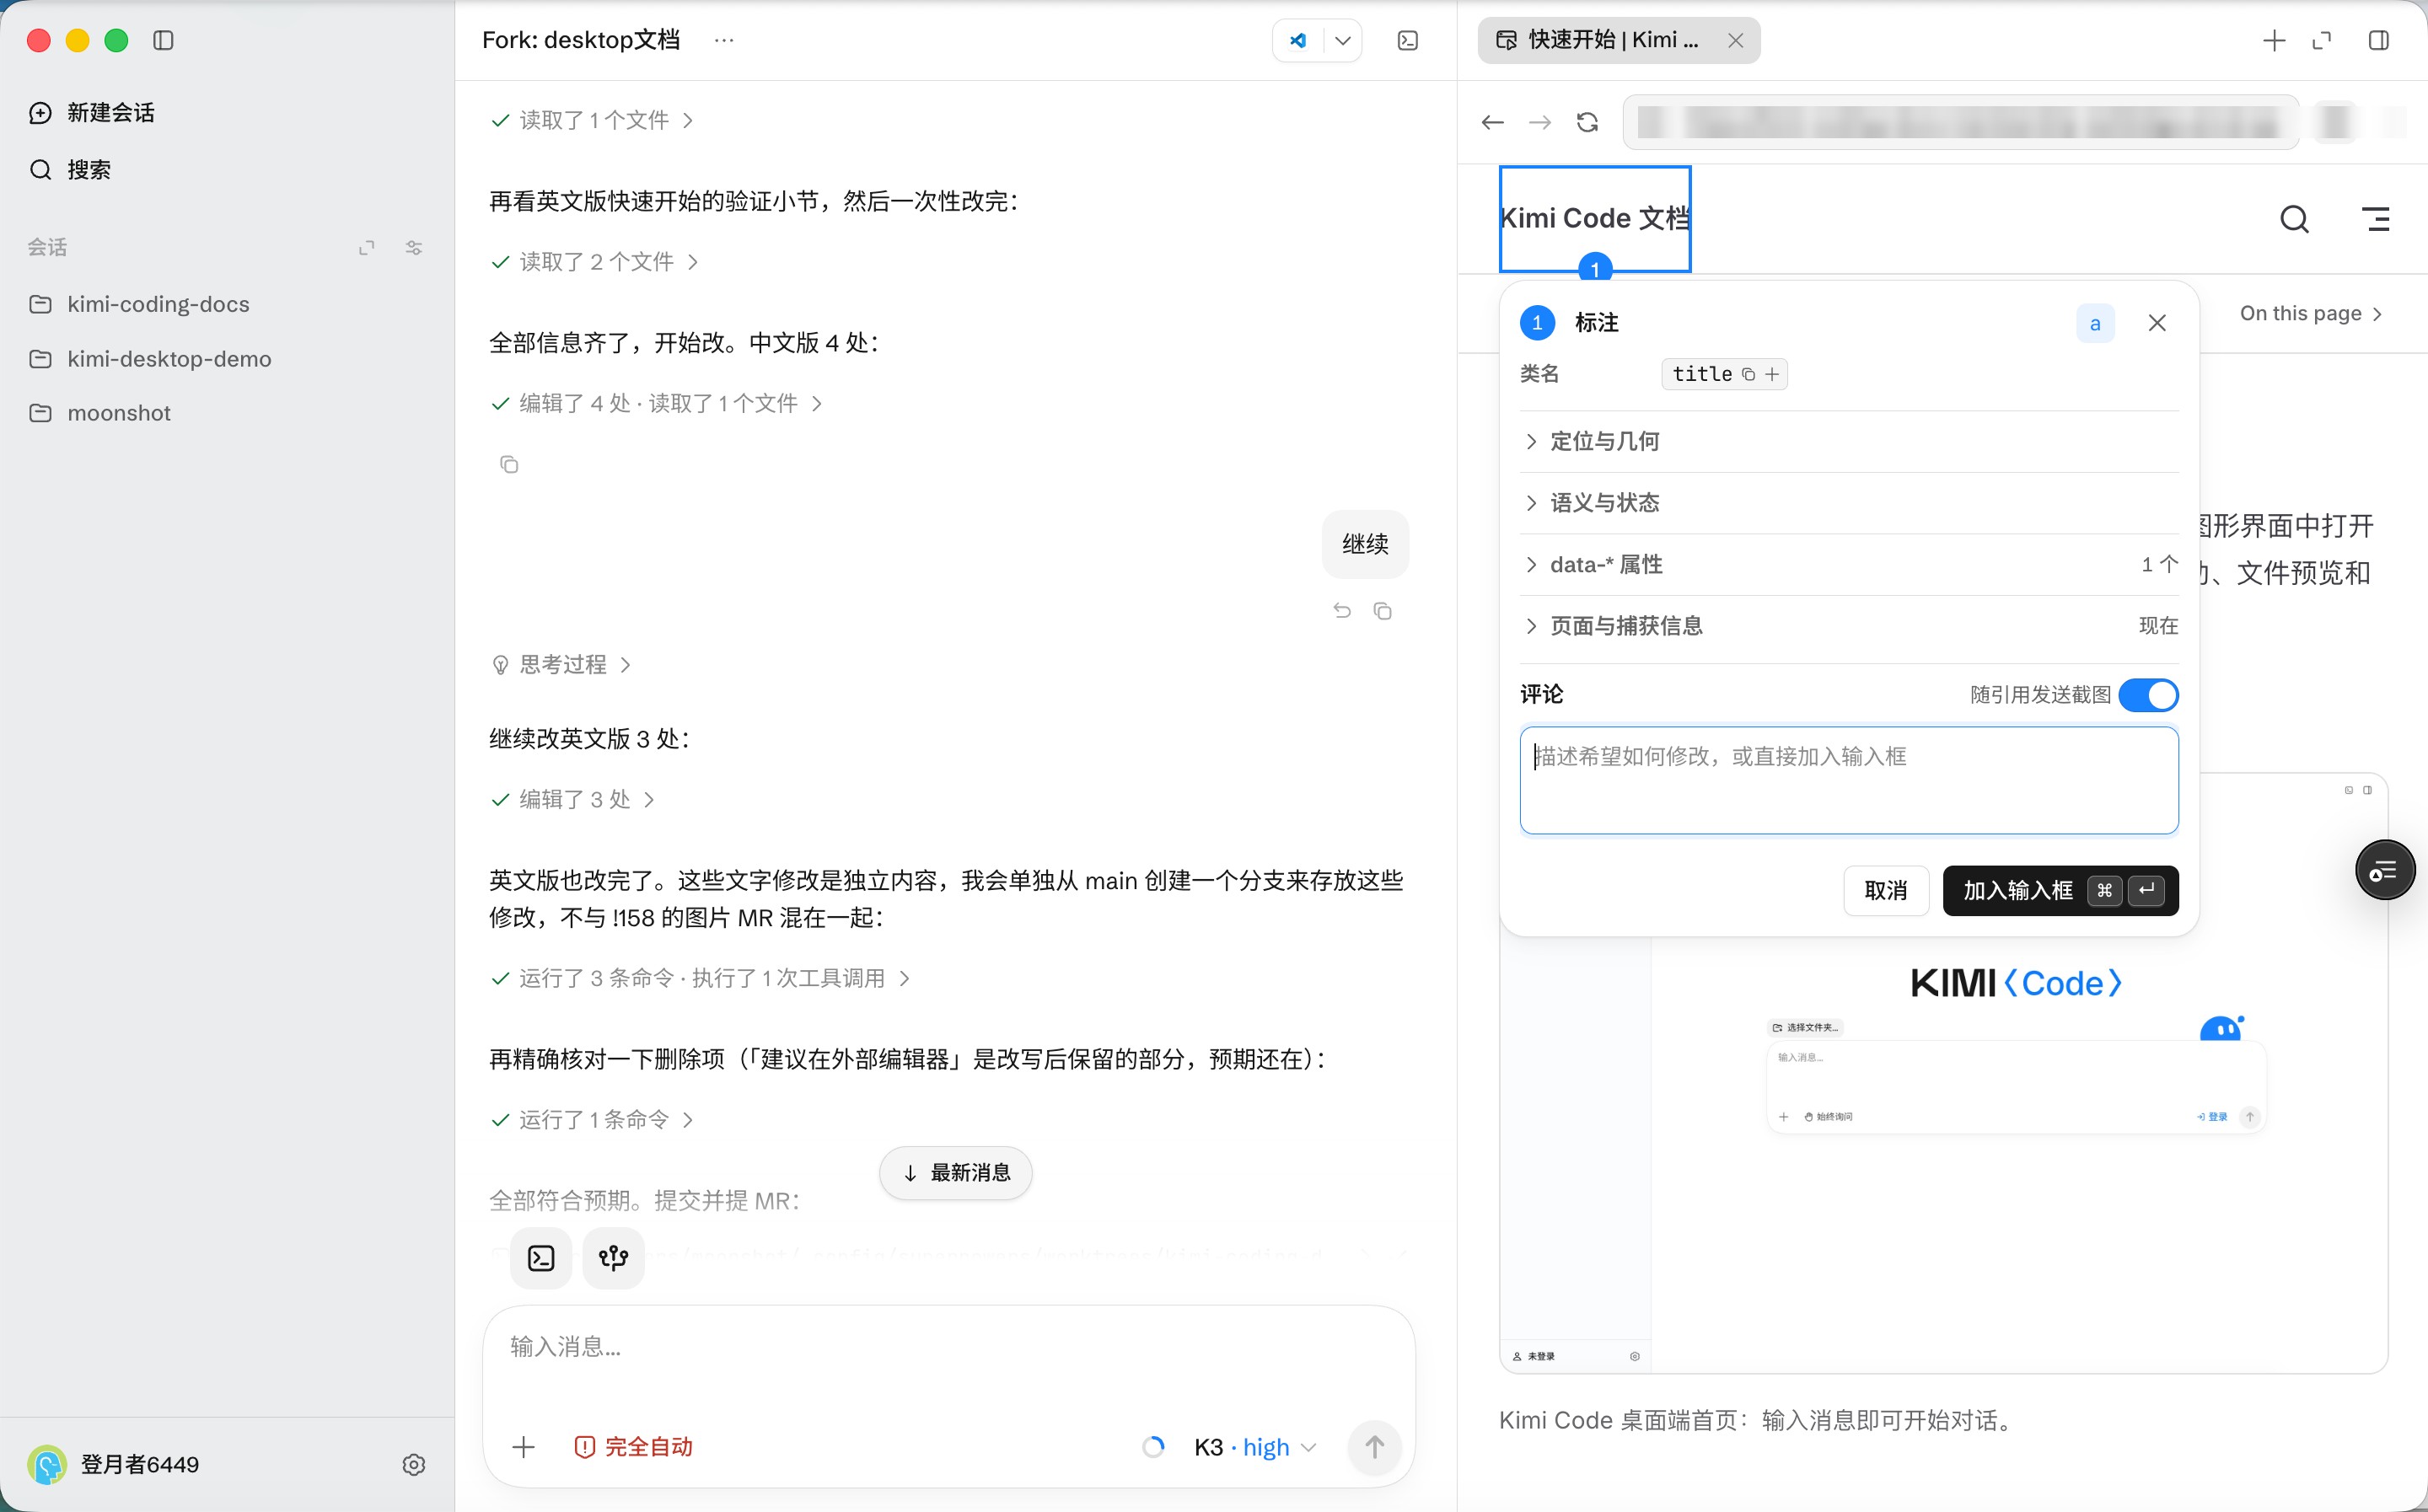
For example, after finding a display issue:
On the article page, the title overlaps the cover image (see the annotation). It should appear below the image. Fix it, then confirm the result in the browser.Manage the browser
The More menu in the upper-right corner of a browser tab provides browsing management entries:
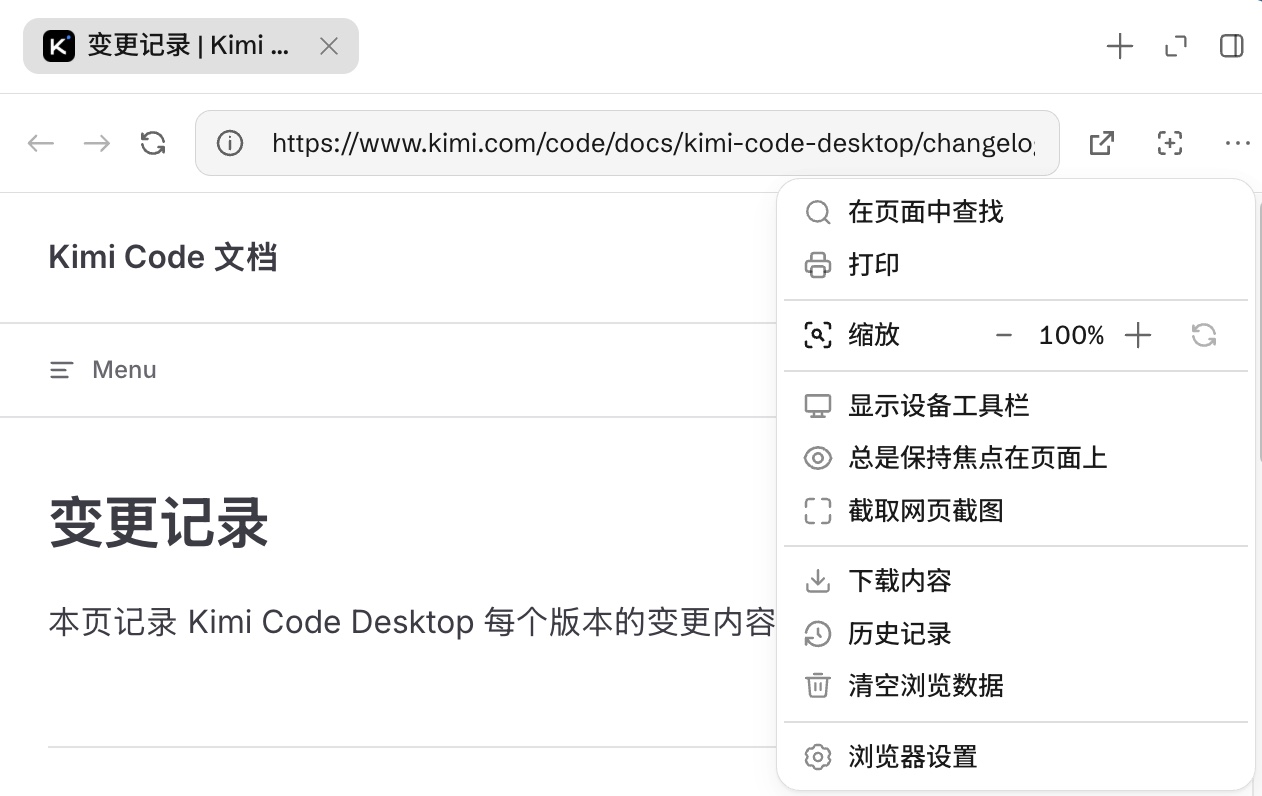
- History / Downloads: view and search your browsing history and download records.
- Clear browsing data: clear the browsing data saved by the browser.
- Browser settings: manage options for the built-in browser.
- Show device toolbar: preview pages at phone, tablet, or custom sizes to adjust the display dimensions and test responsive layouts.